High School Graduation in Philadelphia: 12 Key Questions
What keeps high school students on track to graduation in the School District of Philadelphia?
This FAQ shares what the Philadelphia Education Research Consortium (PERC) has learned about what keeps high school students on track to graduate in the School District of Philadelphia and how our research has been used within the District to support students through graduation.
PERC is a research partnership between the School District of Philadelphia and Research for Action (RFA), has examined the high school experiences and outcomes of youth attending the School District of Philadelphia’s high schools, and how schools can help students succeed.1
This research was possible through the generous support of the William Penn Foundation and the Neubauer Family Foundation.2
What keeps high school students on track to graduation in the School District of Philadelphia?
The Philadelphia Education Research Consortium (PERC), a research partnership between the School District of Philadelphia and Research for Action (RFA), has examined the high school experiences and outcomes of youth attending the School District of Philadelphia’s high schools, and how schools can help students succeed.3
PERC operates through the generous support of the William Penn Foundation and the Neubauer Family Foundation.4
The purpose of this FAQ is to share what PERC has learned and how our research has been used to help high school students. As high school students return to school buildings post-pandemic, we also talk about how research might be used next year to support equitable pathways to graduation.
KEY QUESTIONS
1. What is required to graduate high school with a diploma?
As stated in Bylaw 217 in the School District of Philadelphia policy manual, students earn a high school diploma by completing the following requirements:
- The successful completion of a minimum of 23.5 credits;
- The completion of a service learning projects; and
- Any standards set by Commonwealth laws and regulations.
There is no statewide graduation requirement for the classes of 2021 and 2022.
Senate Bill 1095 was signed into law in 2018 and states that, beginning with the Class of 2023, students in the district will be required to illustrate college, career, and community readiness to graduate through some combination of performance on standardized assessments (i.e., Keystone end-of-course exams in Algebra I, Literature, and Biology), grades in courses associated with each Keystone exam, and/or evidence from student career portfolio (e.g., higher education acceptance, completion of an internship, or full-time employment).
2. Why focus on ninth grade?
Students entering their first year of high school face both opportunities and challenges.5 On the one hand, high school offers greater independence, a wider range of academic and social choices, and expanded opportunities for learning and personal growth. At the same time, the new school environment and increased expectations can be intimidating and overwhelming.
Most ninth graders experience at least some minor stress as they adjust to the demands of high school. But for some, the transition to ninth grade results in more serious problems. The transition to high school can be so jarring that even students who earned good grades and had good attendance in eighth grade can fall off track to graduation in ninth grade.6
Evidence from Philadelphia and other cities shows that students who fall off track in ninth grade have a much higher risk of not completing high school.7 This makes a focus on ninth grade mission critical for preparing students for success after high school.
3. What does it mean for a ninth grader to be “on-track” to graduation?
To understand how well they are supporting ninth graders, more school districts are defining what students must have accomplished at the end of the first year of high school to be considered on track to graduation.
In 2018, SDP established a ninth grade on-track definition. To be considered on track to graduation a student completing the first year of high school must have earned:
- At least one credit in each core subject (English, mathematics, science, and social studies)
- One additional credit in any subject.
In contrast, ninth-grade students who do not earn these foundational five course credits finish their first year of high school “off track” to graduation.
The district now regularly reports the percent of ninth graders who are off track at the end of each year. Most recent district data show that, among students who entered ninth grade in 2019-20, nearly one in five (18%) ended the year off-track to graduate.
4. How well does ninth grade “on-track” performance predict graduation four years later?
There is a close association between being on track in ninth grade and graduation four years later. We see this in our research, where we show that graduation rates for off-track ninth graders are much lower than their on-track peers.
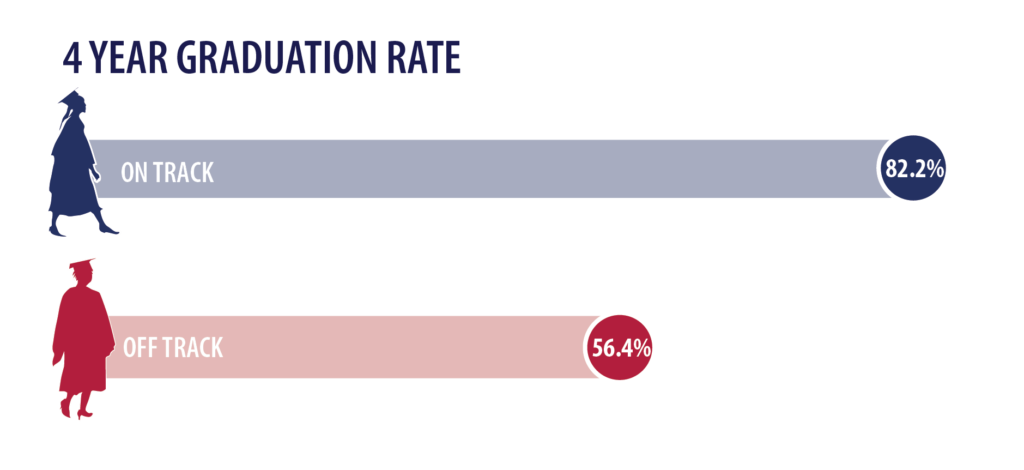
When we compared 4-year graduation rates for on- and off-track first-time ninth graders, we saw a graduation rate of 82% for on-track ninth graders, but only 56% for off-track ninth graders, a considerable difference of about 26 percentage points.
Figure 1. The four-year graduate rate of off-track ninth graders is considerably lower than their on-track peers.

5. Does the number of credits missed in ninth grade make a difference?
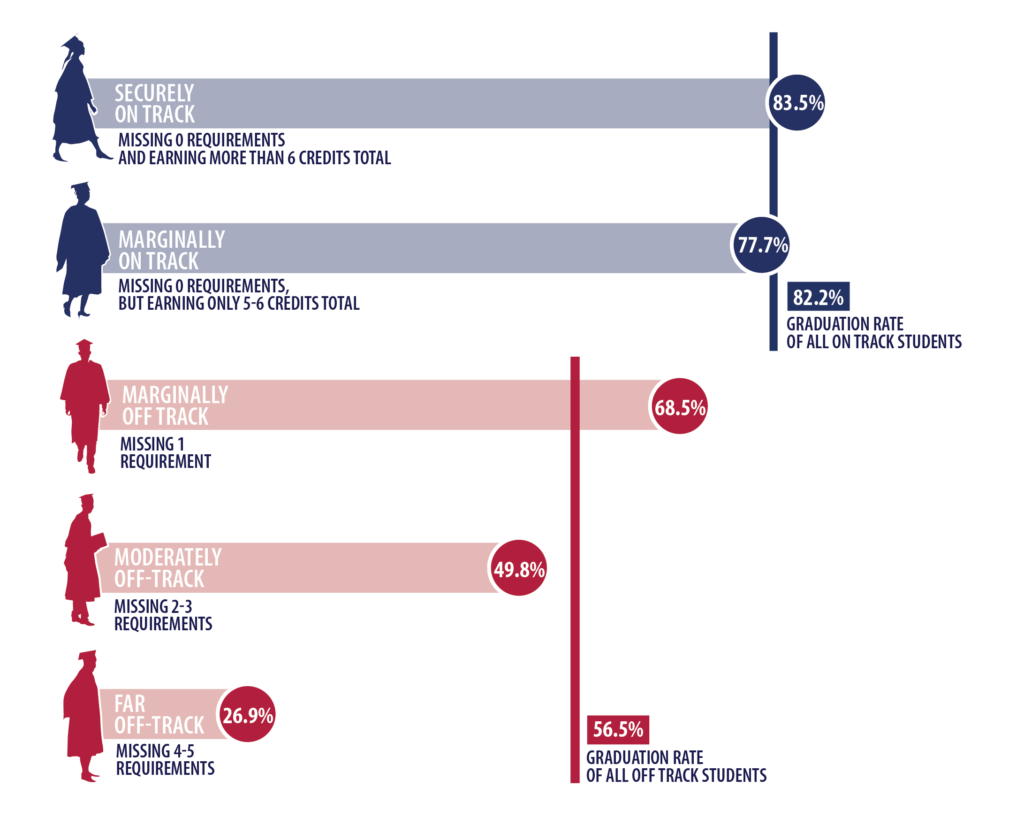
Yes. When we compared graduation rates by number of credits missing at the end of ninth grade, we found that the farther off track a student is at the end of ninth grade, the lower their graduation rate. The graduation rate for students missing just one of the five indicators of being on track was about 69%, compared to rates of about 50% of students missing 2 or 3 requirements and about 27% for students missing 4 or 5.
Figure 2. The farther off track a student is at the end of ninth grade, the lower their graduation rate.

6. What can be done at the start of ninth grade to prevent students falling off track?
School administrators have ready access to data systems and dashboards that enable them to look at the prior school performance of incoming ninth graders. Early on in the school year, administrators can engage with student data to identify and support entering ninth graders who are at greater risk of falling off track.
Our work points to several data points that schools can use to identify students at outsized risk of falling off track. PERC identified four 8th grade indicators that high school principals can use to flag students at the start of the school year who are at risk of being off track in ninth grade:
![]()
These four characteristics identified approximately 30% of students who were off track by the end of ninth grade. Of course, identifying students at risk is not the same thing as developing an effective solution for each student’s particular set of challenges. But it is one of the first steps toward putting in place strategies to help students get on track to graduation.
7. What can be done during ninth grade to prevent students falling off track?
Research points to two high-yield strategies to employ throughout the school year for supporting ninth graders who are at risk of falling off track:
A. Supporting high attendance
The transition to ninth grade is made more challenging when students disengage and stay away from school. One of the best things schools can do to support struggling students is identify and address attendance issues early on. School strategies should address root causes of poor attendance, which can vary substantially and include child, family, peer, school, and community factors.
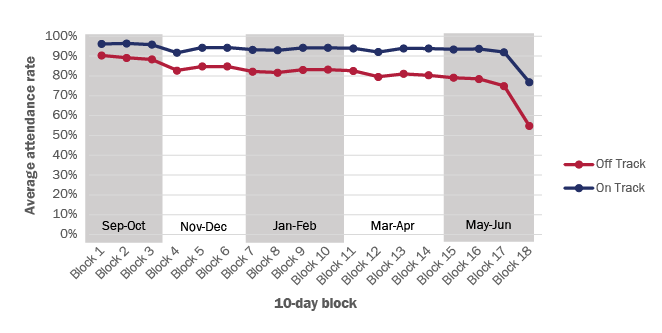
Students who have poor attendance tend to have lower achievement in their core courses and more often end up off track at the end of their first year of high school, as we show in our report. The graph below shows average attendance rates over a school year for on- and off-track ninth graders. Starting from the first two weeks of school, students who ended the year on track had a higher attendance rate than those who ended the year off track. The gap between the two groups widens as the school year progresses.
Figure 3. Starting from the first two weeks of school, students who ended the year on track had a higher attendance rate than those who ended the year off track.

B. Providing intensive tutoring
Research in other districts has shown the benefits of helping students prior to course failure by providing intensive or high-dosage tutoring (e.g., three or more sessions a week), particularly in schools where many students are struggling.8
There is a growing conversation around scaling high-dose tutoring to make it a core feature of districts’ COVID-19 responses to student academic challenges.9 For more on the possible benefits of tutoring (for students, tutors, and communities more broadly) and ideas on how to implement cost-effective high-dose tutoring at scale, we recommend:
![]() Reading: Research brief on accelerating student learning with high-dosage tutoring from Carly Robinson, Matthew Kraft, Susanna Loeb, and Beth Scheuler
Reading: Research brief on accelerating student learning with high-dosage tutoring from Carly Robinson, Matthew Kraft, Susanna Loeb, and Beth Scheuler
![]() Listening: Andy Feldman’s Gov Innovator Podcast with Matthew Kraft and Grace Falken
Listening: Andy Feldman’s Gov Innovator Podcast with Matthew Kraft and Grace Falken
8. How can “off-track” students get back on track?
Once students fail a course, they need accessible pathways to recover failed credits to get back on track. The district offers three different credit recovery options:
- Re-taking the course in full in the traditional classroom format,
- Taking a compressed credit recovery course in a face-to-face format, and
- Taking a compressed credit recovery course though a web-based recovery platform (e.g., Edgenuity.
The demand for credit recovery is very high in the district. It remains to be seen what the demand for credit recovery will look like post-pandemic, but data from 2017-18 show that one-quarter of SDP high school students —and one in three students in Grade 10—were eligible to recover credit in a core course by the end of the year.
9. Are credit recovery options working to get students back on track?
While SDP is relatively unique in the number of options offered for students needed to recover credits, our research suggests that more investment in remediation practices could get more students back on track. Here we present some data that shows where in the process students need more support.

A. Credit recovery attempts
In 2018-19, only half of SDP students who were eligible for credit recovery attempted to recover at least one missing course, suggesting a need for more access to pathways for credit recovery for district students.
B. Credit recovery completion
Though enrollment in credit recovery each year may not meet demand, credit recovery course completion is high. A large majority of students who enrolled in credit recovery courses completed the course (nearly 80%).
C. Pass rates for credit recovery courses
Though completion rates are high, pass rates for credit recovery courses are low. Only half of completed course attempts in 2018-19 resulted in a passing grade.
![]() Pass rates for completed course attempts were higher in traditional course formats (58%), relative to in-person (45%) and web-based (37%) alternative recovery formats.
Pass rates for completed course attempts were higher in traditional course formats (58%), relative to in-person (45%) and web-based (37%) alternative recovery formats.
These different rates could reflect either differences across credit recovery modes in effectiveness, student needs, or both. More research could help unpack why modes have different pass rates, though all modes have relatively low pass rates. This indicates that, no matter the mode, students who attempt credit recovery need more support for successfully recovering failed courses.
10. Which students and schools need the most support?
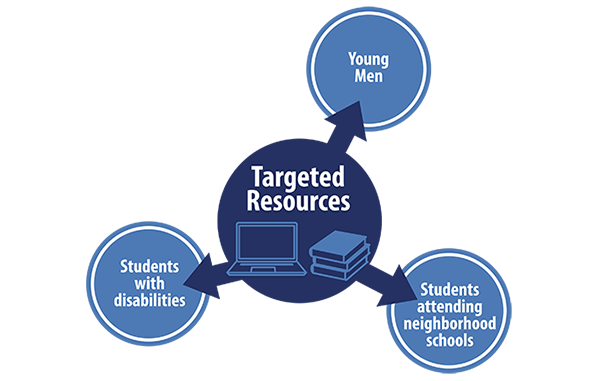
Across all of our recent reports, our work suggests a need for targeted resources to better support young men, students with disabilities, and students attending neighborhood schools.10

- Male students were more often off track at the end of their ninth-grade year (thus eligible for credit recovery) compared to females. While credit recovery enrollment and pass rates were similar for male and female students, more off-track male students were “far off-track” and, three years later, their graduation rate was nearly 12 percentage points lower than that of off-track females.
- Students receiving special education services in ninth grade were more often off track, farther off track, and experienced lower graduation rates than their peers not receiving special education services. Students with disabilities had a much lower pass rate for credit recovery courses (27%) compared to students who did not receive services (39%).
- Off-track students at Neighborhood high schools experienced graduation rates that were more than 20 percentage points lower than their off-track peers at Citywide and Special Admission schools. Pass rates in credit recovery courses were lowest (35%) among students attending Neighborhood schools compared to students attending Citywide (55%) and Special Admission schools (44%).
11. How has this district used this research to help students?
PERC’s high school research from 2018-2020 provided evidence to support district-wide use of the ninth grade on-track indicator in school accountability frameworks and school profiles, and to support the use of a multi-category on-track indicator within principal data dashboards to identify students who need additional intervention.
12. How can this research help students as they return to school buildings post-COVID?
The pandemic coupled with new statewide high school graduation requirements mean it’s a smart time to use research to understand how students can be supported through graduation.
The district is working to rise to new challenges with an equity lens to effectively support students during high school to prepare for life afterwards. In December 2020, the District’s School Board announced new 5-year “goals and guardrails,” and each month the Board updates the public on progress against these goals, with specific, measurable indicators.
Our research supports the Board’s approach to monitoring interim indicators as an approach to supporting student pathways to graduation.
Our findings point to key areas for the Board and the public to monitor as students return to school buildings that complement the Board’s focus on high school math, English, and Career and Technical Education performance: Include the district’s ninth grade on-track indicator as a key data point to monitor and, given their disproportionate needs, monitor outcomes for students attending neighborhood schools, young men, and students with learning delays or disabilities when assessing school progress toward the goal of all students graduating college and career-ready.
